Researchers, academics, and scientists often spend hours—sometimes days—creating figures for manuscripts, grants, and presentations. Traditional tools like GraphPad Prism or BioRender require technical skill, while generic AI image generators produce inaccurate, unusable visuals. This gap between raw data and publication-ready graphics represents a significant bottleneck in scientific communication and productivity.
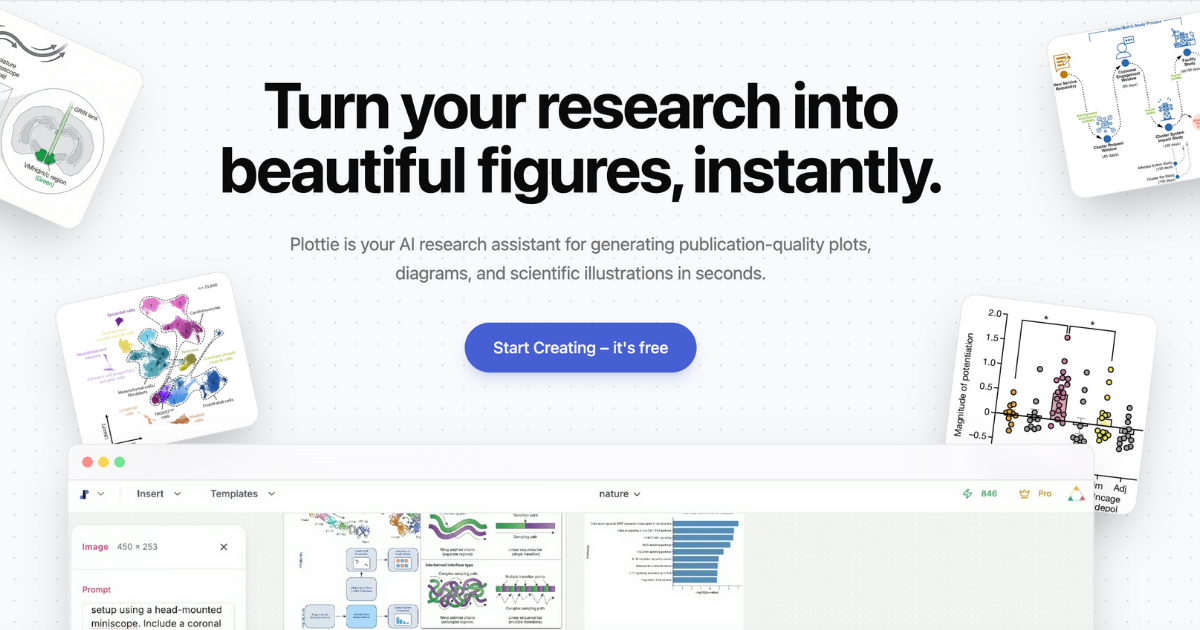
Plottie is a specialized AI tool designed specifically for the rigorous demands of scientific visualization. It transforms datasets and descriptions into accurate, publication-quality figures, diagrams, and charts. Unlike generic AI art tools, Plottie is built with an understanding of scientific conventions, proper labeling, and structural accuracy, positioning itself as a no-code alternative to complex statistical graphing software and premium illustration platforms.
Key Features
- AI-Generated Scientific Figures: Upload your data or describe your visualization need in plain English. Plottie's AI engine generates accurate bar charts, line graphs, scatter plots, box plots, and more, formatted correctly for scientific standards.
- Accurate Scientific Illustration: Goes beyond generic AI art. The tool understands scientific context, ensuring labels, scales, and diagram structures (like cell diagrams or pathways) are precise and not hallucinated, which is critical for credibility.
- No-Code, Intuitive Workflow: Eliminates the need for programming in Python/R or mastering advanced features in GraphPad. The interface is designed for researchers who want to focus on their science, not software.
- Export-Ready Outputs: Generates high-resolution figures suitable for direct inclusion in top-tier journal submissions, grant proposals, and presentation slides without requiring additional polish in other software.
- Direct Alternative to Established Tools: Built specifically as an AI-powered alternative to GraphPad Prism for statistical plots and BioRender for scientific illustrations, consolidating two needs into one accessible platform.
Who Is This For?
- Academic Researchers & PhD Students: Quickly generate figures for dissertation chapters, journal manuscripts, and conference posters without diverting time from core research activities.
- Lab Managers & Principal Investigators: Streamline the figure creation process for grant applications (NIH, NSF) and lab publications, ensuring consistent, professional quality across all materials.
- Biotech & Pharma Professionals: Create clear data visualizations for internal reports, investor presentations, and regulatory documents with accuracy and speed.
- Science Educators & Communicators: Develop clean, didactic diagrams and charts for textbooks, lecture slides, and public outreach materials to explain complex concepts effectively.
Under the Hood
Plottie leverages AI models fine-tuned on scientific datasets and visualization principles. The technology prioritizes accuracy in data representation over artistic flourish, distinguishing it from broad-purpose image generators. It appears to be a web-based SaaS application, ensuring accessibility from any device without installation. The platform's recognition by directories like Twelve Tools and Aidirs suggests a focus on the AI tool ecosystem.
Get Started
Getting started is straightforward. Visit the Plottie website, and you can likely begin creating with a free account. The process involves either uploading a data file or describing the figure you need. The AI handles the technical execution, allowing you to review, make minor adjustments, and export. The learning curve is minimal, especially for anyone familiar with the end goal of scientific figure creation.
Plottie democratizes scientific visualization, turning a time-intensive, technical task into a simple, conversational process. It empowers scientists to communicate their findings with clarity and impact, faster than ever before.